Can AI Purely Use Maths to Outperform the Majority of Active Fund Managers?

Every day, thousands of fund managers spend hours estimating risk, comparing returns and testing how their portfolios might behave in the future. Artificial intelligence can run many of these calculations in minutes. Beating the very best fund managers takes more than arithmetic, but beating most of them may not. This article asks whether an AI, using nothing but well-established mathematics, could build a ten-year portfolio that outperforms the majority of active fund managers.
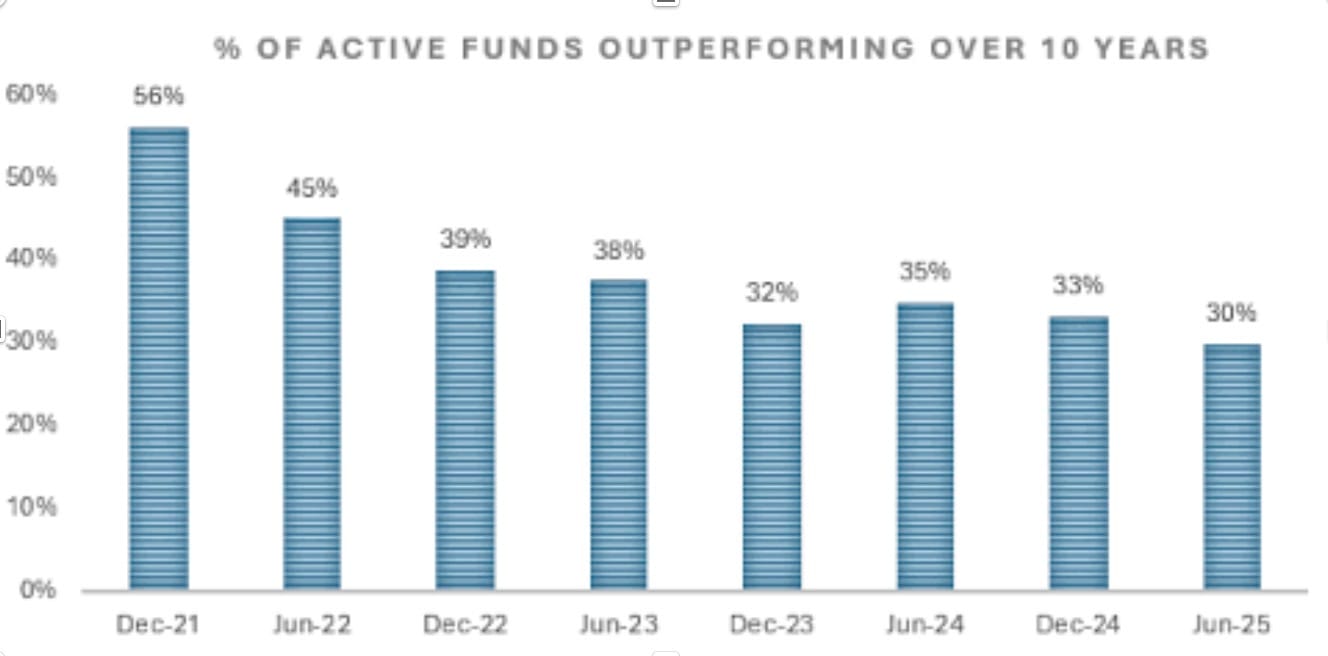
The bar is lower than many people expect. AJ Bell's Manager versus Machine report found that over the ten years to November 2025, just 24% of active managers in its sample beat a comparable passive fund, the weakest result since the report began in 2021. In other words, a portfolio that simply kept pace with a cheap tracker fund would already have beaten roughly three in every four active managers.
Credit: Trustnet
To meet that standard, our AI would work through four mathematical tools in turn:
- The Markowitz model finds the combinations of assets that give the best expected return for each level of risk.
- The Sharpe ratio scores each portfolio on its return per unit of risk, so the single "best" one can be chosen.
- Monte Carlo simulation tests that portfolio against thousands of possible futures.
- Correlation checks that the assets inside it do not all rise and fall together.
The Markowitz Model
Credit: Encyclopaedia Britannica Inc.

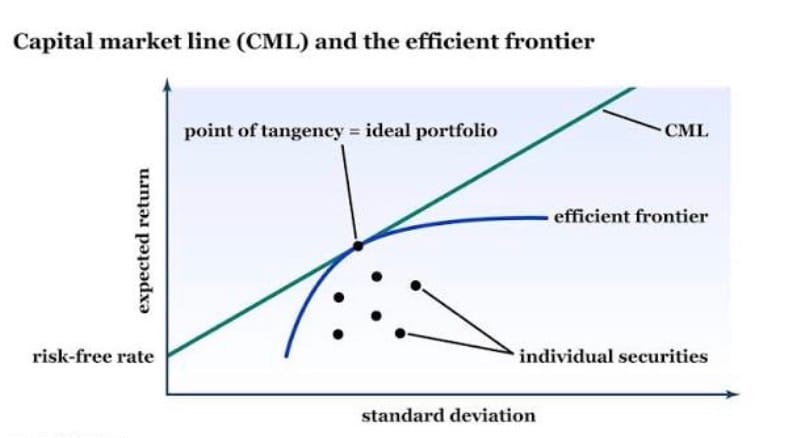
In 1952, the economist Harry Markowitz published a paper called "Portfolio Selection" in The Journal of Finance. It set out what became known as modern portfolio theory, and it later earned him a Nobel Prize in 1990. Markowitz measured risk as the standard deviation of an asset's returns, and he showed that the right mix of assets can deliver a better trade-off between risk and return than any single asset alone. The set of portfolios offering the highest expected return for each level of risk forms a curve called the efficient frontier.
For an AI, the first job is estimation. It must calculate each asset's expected return and volatility, plus how every pair of assets moves together. With 1,000 assets, that means 999,000 ÷ 2 = 499,500 separate pairings, which is exactly the kind of heavy, repetitive work computers do well. The AI then draws the capital market line (CML), which starts at the risk-free rate and rises until it just touches the efficient frontier. The point where it touches is called the optimal risky portfolio, and the AI finds the asset weights that place its portfolio exactly there.
The Sharpe Ratio
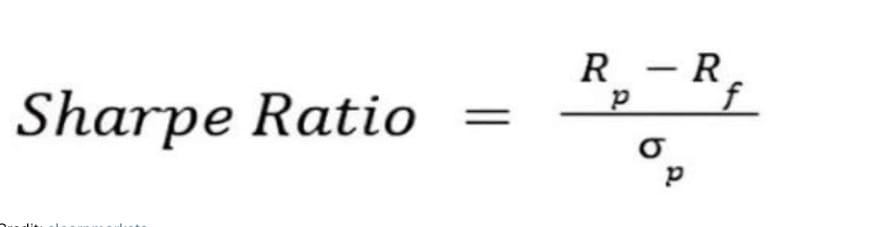
The Sharpe ratio, created by the Nobel Prize winner William F. Sharpe, measures how much extra return an investment earns for each unit of risk it takes. It uses three inputs, all of which appear on the Markowitz diagram above: the portfolio's expected return (Rp) on the vertical axis, the risk-free rate (Rf), such as the return on a government bond, and the portfolio's volatility (σp) on the horizontal axis.
Credit: elearnmarkets
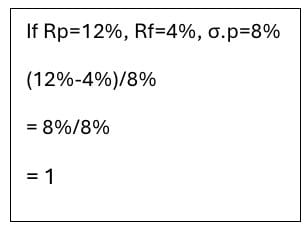
Suppose a portfolio is expected to return 12% with a volatility of 8%, and the risk-free rate is 4%. Its Sharpe ratio is (12% − 4%) ÷ 8% = 1, meaning it earns one unit of excess return for every unit of risk. If the expected return rose to 20% with the same volatility, the ratio would double to (20% − 4%) ÷ 8% = 2. The AI calculates this score for every candidate portfolio and ranks them; the optimal risky portfolio from the Markowitz step is, by definition, the one with the highest score.
There is an important catch. The Sharpe ratio is only as reliable as the estimates fed into it, and expected returns are especially hard to forecast. A small error in those estimates can shift the "best" portfolio's weights dramatically, so the precision of the maths can hide the uncertainty of its inputs.
What Does a Sharpe Ratio of 1 Actually Mean?
A Sharpe ratio of 1 means that for every 1 unit of volatility (risk), the investment produces one unit of excess return. In this example, 1 unit of volatility is 8% and one unit of excess return is 8% (12%-4%).
Thus, a higher Sharpe ratio will mean that the investment will produce more excess return compared to the risk taken. E.g. (using the example above), if the expected return increased to 20%, and the volatility stayed the same, you would get a Sharpe ratio of 2: (20%-4%)/8%.
In this case, all of the inputs for the Sharpe ratio are calculated from the Markowitz model meaning that the accuracy of the Sharpe ratios depends entirely on how accurate the Markowitz model is.
Monte Carlo Simulation
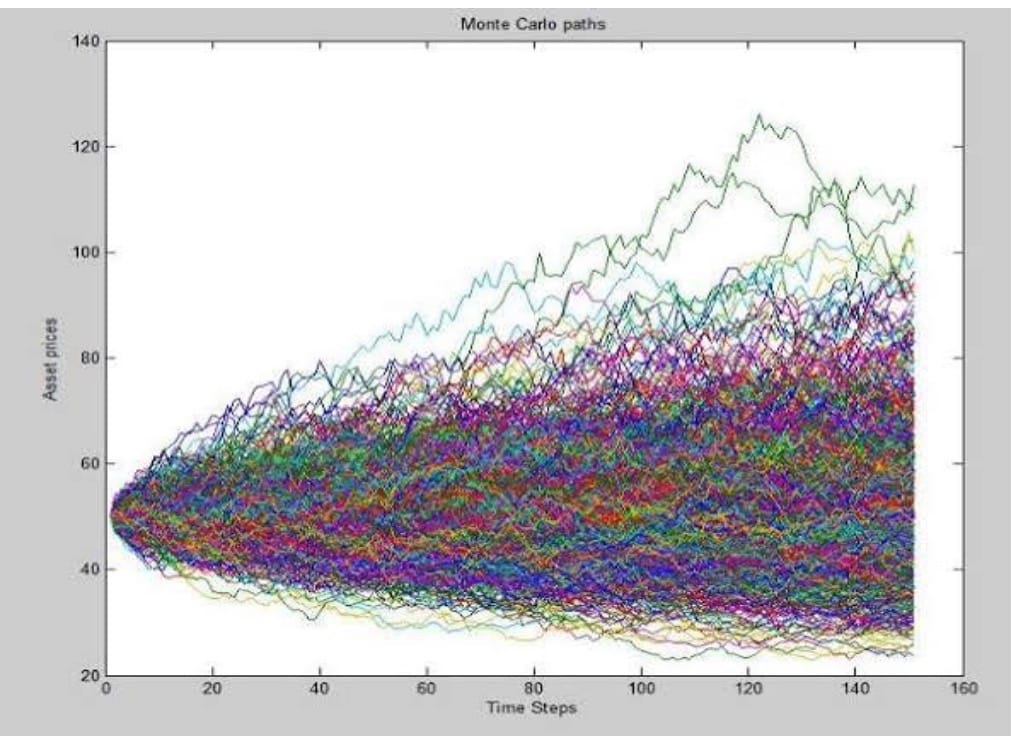
Once the AI has chosen its portfolio, it needs to see how that portfolio might fare over ten years. Monte Carlo simulation, a technique that grew out of nuclear research in the 1940s, does this by generating thousands of possible futures from probability distributions rather than relying on a single forecast. It works in four steps:
- Define the inputs and their distributions. The AI decides which quantities are uncertain, such as each asset's yearly return, and how likely each value is. Using the averages, volatilities and correlations it estimated earlier, it might judge that a yearly return near 8% is far more likely than one of −10% or +20%.
- Draw random values. The computer samples from those distributions to produce one possible path: perhaps +17% in year one, −4% in year two, +8% in year three, and so on.
- Compute the outcome. Each path is fed through a fixed calculation. For example, £100 growing by 7% becomes £107, and repeating this year by year gives the portfolio's value after ten years. The same inputs always give the same answer, so all of the randomness comes from step 2.
- Analyse the results. After thousands of paths, the AI studies the spread of outcomes: the average, the best and worst cases, and the probability of a loss.
If 7,000 out of 10,000 simulated paths end in profit, the model estimates a 70% chance of a positive return. That figure is only as good as the assumptions behind it, however, since the real market is not obliged to follow the AI's chosen distributions.
Credit: analytica
Correlation
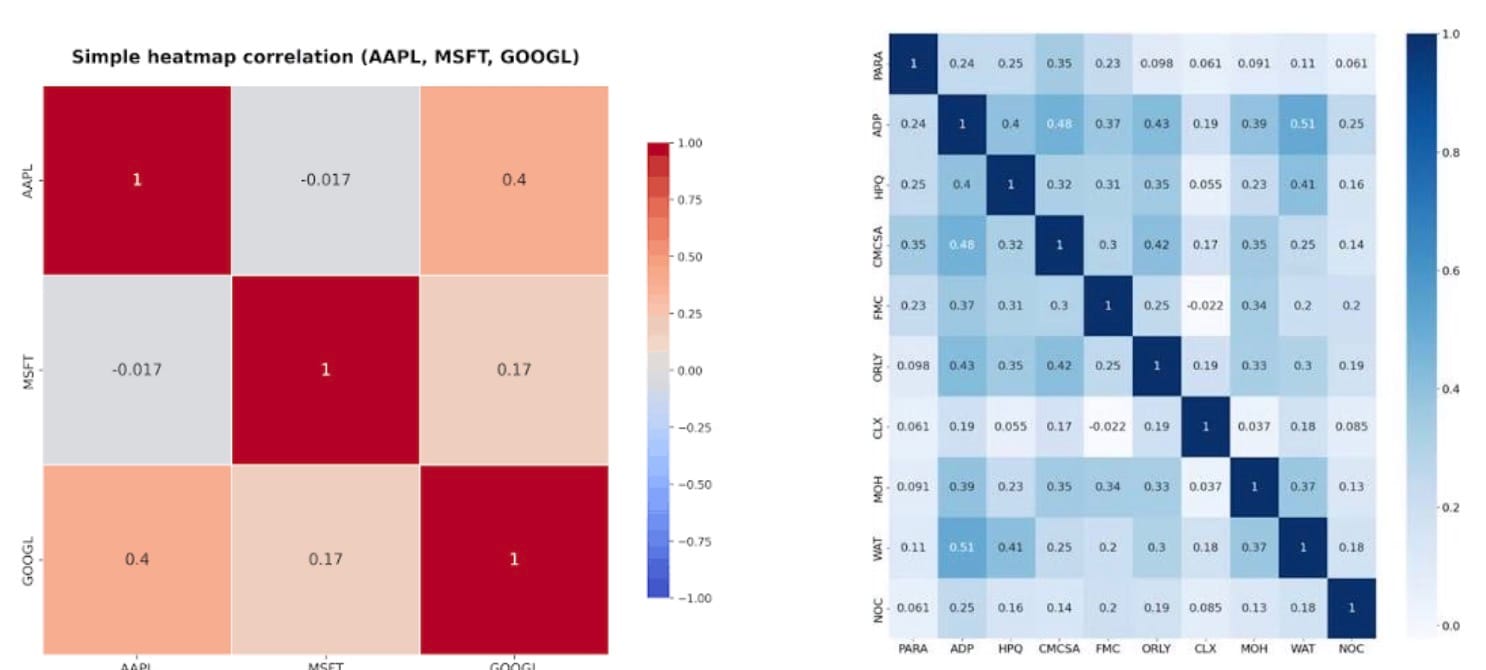
The final check is diversification. Correlation measures how closely two assets move together on a scale from −1 to +1. A value of +1 means they move in perfect step, −1 means they move in exactly opposite directions, and 0 means there is no linear relationship at all. In practice, exact values of +1 or −1 are rare, and most pairs of assets fall somewhere in between.
Low or negative correlations matter because they cushion a portfolio: if one asset falls for an unexpected reason, the others are less likely to fall with it. Data provider Twelve Data found that Apple and Microsoft shares often have correlations above 0.8, so holding both adds little protection, whereas Apple and ExxonMobil showed a correlation of about 0.22. The AI would display these figures as a correlation matrix, often coloured as a heat map, and confirm that its chosen portfolio is not secretly a bet on a single type of company.
The diagrams below represent the correlation between lots of real-life businesses
Credit:Twelvedata Credit: Research gate
The Limits of Pure Maths
Every one of these tools rests on assumptions, and markets do not always respect them. Critics of modern portfolio theory point out that it assumes returns follow a normal "bell curve" and that correlations stay constant. Neither holds reliably. According to Analytica, a bell-curve model suggests that a one-month fall of more than 13% in the S&P 500 should be almost impossible, yet such falls have happened at least ten times since 1926. Many Monte Carlo models also failed to anticipate the 2008 financial crisis.
Correlations cause a similar problem. Twelve Data notes that correlations tend to rise during crises such as the COVID-19 pandemic, which means diversification weakens just when it is needed most. Sudden events, from the pandemic in 2020 to the 2025 US tariff announcements, cannot be predicted from past data, and their effect on a ten-year portfolio depends heavily on when it entered the market. Humans may also keep an edge in judging events with no historical precedent, so it would be too early to treat a purely mathematical approach as flawless.
Conclusion
After these four stages, the AI would have built a ten-year portfolio using nothing but mathematical formulae, and it could do so in minutes rather than days. Whether that portfolio would actually beat most fund managers cannot be proven in theory. The fairest test would be a backtest: building the portfolio using only data available at the start of a past decade, then comparing its real returns with those of active funds over the following ten years.
There is good reason to think it could succeed. Since only around a quarter of active managers have beaten a passive alternative over the past decade, the AI does not need to be brilliant; it needs only to diversify well and keep its costs low. Interestingly, that is the same lesson Britannica draws from Markowitz's work, which helps explain the appeal of low-cost index funds. AJ Bell also cautions that active managers' recent struggles reflect particular market conditions, such as the strength of the largest technology companies, so the picture could change. Perhaps the most likely future is not AI replacing fund managers, but fund managers who use AI to handle the calculations while they focus on the judgement that maths alone cannot provide.
Bibliography
AJ Bell. "https://www.ajbell.co.uk/sites/ajbell/files/Manager-v-Machine-Dec-H2-2025.pdf." AJ Bell | Award-Winning Investment Platform, Dec. 2025, www.ajbell.co.uk/sites/ajbell/files/Manager-v-Machine-Dec-H2-2025.pdf. Accessed 17 Oct. 2026.
Bajaj, Vivek. "Sharpe Ratio: Meaning, Formula & Example Explained." Elearnmarkets - Learn Stock Market, Trading, Investing for Free, 3 Nov. 2025, blog.elearnmarkets.com/what-is-sharpe-ratio/. Accessed 17 Oct. 2026.
Ganti, Akhilesh. "Unlocking Portfolio Potential with the Efficient Frontier." Investopedia, 21 Aug. 2026, www.investopedia.com/terms/e/efficientfrontier.asp. Accessed 17 Oct. 2026.
Hayes, Adam. "Understanding Correlation in Finance and Its Calculation Formula." Investopedia, 7 May 2026, www.investopedia.com/terms/c/correlation.asp. Accessed 17 Oct. 2026.
Kraszek, Rafal. "Monte Carlo Simulation of Stock Market Returns." RPubs, 9 June 2021, rpubs.com/minnasan/monte_carlo_simulation_of_stock_market_returns. Accessed 17 Oct. 2026.
Logue, Ann C. "Harry Markowitz and modern portfolio theory." Britannica, www.britannica.com/money/modern-portfolio-theory-explained. Accessed 17 Oct. 2026.
https://www.open.edu/openlearn/mod/oucontent/view.php?id=20931§ion=2.3